
Measurement of Efficiency and Production Capability of Durian in Southern Thailand
Phongparnich Rapee1*
Department of Economics, Faculty of Liberal Arts and Management Sciences, Prince of Songkla University, Surat Thani Campus.
*Corresponding author: rapee.p@psu.ac.th
DOI: https://doi.org/10.5281/zenodo.16924387
Abstract
This study aimed to increase the efficiency and production of durian in Thailand’s southern region. An SBM-DEA approach was applied to improve and increase efficiency in durian production, and a Tobit regression analysis was performed to identify factors affecting efficiency. As a result, the technical efficiency of 600 DMUs from the decision-making unit is calculated to average 0.520962. As a result of the findings, it can be concluded that controlling fertilizers and chemicals used to prevent/kill pests could improve the efficiency and production of durian in Southern Thailand. There were four factors found to be statistically significant. The changes in efficiency level could not be affected by variables related to education and membership in agricultural organizations. There is a limitation on data storage. Because durian farmers did not record all the data, this limitation caused a delay in recording the information on the research platform. Control of input variables and increase household size, male farmers, experience unit, and number of times to attend training, respectively. It can raise the high-efficiency score of durian farmers. Durian farmers still need the knowledge to manage their variable factor uses. Significantly, they comprise the technology used in agricultural machinery, information technology systems, and chemical or pesticide knowledge.
Keywords: durian, efficiency, production, SBM-DEA approach, Tobit regression model.
1. Introduction
The durian is an important export commodity for Thailand’s produce industry, contributing significantly to the country’s economy. It is regarded as the leading export product in Thai fruits and is distributed to numerous global markets. The principal markets include China, Hong Kong, and Vietnam regions, with a substantial demand for durians. There are four exportable durian products: fresh durian, refrigerated durian, desiccated durian, and durian stir. Based on the information in Table 1, it was determined that the value and quantity of fresh-processed durian exports increased annually from 2010 to 2021. Exports of durian and related products generate income for the country.
As a consequence, the total export volume was 5,741,468 tons, and the total value was 378,556 million baht, surpassing the volume and value of fresh durian exports, which were
5,464,966 tons and 337,688 million baht, respectively. Next, dried durian exports are 257,636 tons and 36,395 million baht, respectively, and durian stir has a quantity and value of 14,424
tons and 44.5 million baht, respectively. Thailand has been the export champion of durian for twelve consecutive years. It was discovered that the quantity and value of durian exports from Thailand increased exponentially in 2017 with a growth rate. This trend has continued to the present day. Almost all Thai durians have recently been sold to China as fresh fruit, as Thailand was the only country allowed to sell fresh durians for many years. China is currently opening up to durians from other nations. They recently permitted Vietnam and the Philippines to sell fresh durians in China. Vietnam was granted a license as the second nation in July 2022 and has marketed durians at prices comparable to Thailand’s, acquiring more than 5% of the market share. In January 2023, the Philippine was granted the most recent approval and began introducing local Puyat durians for Chinese customers to taste (The Bank of Thailand, 2023).
According to statistics, the quantity and average price of durian were mentioned previously. The annual growth rate is increasing, which can be explained by economic theory relating to market supply and demand. It has both positive and negative effects on Thailand’s durian producers. During the short term, farmers who produce durian will earn a satisfactory income from their products, and their input costs can be turned back multiple times from durian cultivation. In the long term, however, durian producers will sell durian at a reduced price and in proportionally smaller quantities. The cause is durian production technology has advanced, and more durian cultivation areas are being established by farmers in the ASEAN and China regions, which creates intense competition in the future (Department of Agricultural Extension, 2019), Along with agricultural issues, durian production faces problems such as diseases, parasites, natural disasters, climatic conditions, and tree care. However, a significant issue still affects the durian’s value. Thai durian is under competition from new entrants into the market, and Chinese customers are becoming increasingly interested in durians from other nations. At present, Thailand has urgent plans regarding the quality policy of durian planting and harvesting. From the report on developing and promoting agriculture to create value according to the national strategy: A case study of durian products by the Senate Committee on Agriculture and Cooperatives. There are urgent issues that need to be implemented as soon as possible: urge farmers to adopt GAP standards to control the quality of durian production throughout the durian production chain using GMP certification from the Department of Agriculture of Thailand (Senate Secretariat, 2023).
All parties concerned, both public and private, should be aware of and prepared to cope with potential durian concerns in Thailand. As mentioned above, this is consistent with the study of Thongkaew, Jatuporn, Sukprasert, Rueangrit, and Tongchure (2021). Their study surveyed 395 durian growers, focusing on the factors impacting durian production in Thailand. They propose that farmers, the government, and other stakeholders gain from offering insights that may improve the efficiency of durian production, resulting in high-quality durians for both domestic and international customers. Moreover, Lassoued, Phillips, and Smyth (2023) describe how advancing technologies transform agriculture from a labor-intensive to a technology-intensive industry. The authors focus on using precision agriculture and intelligent technology, including sensors, agricultural monitoring software, telematics, drones, robotics, and machine learning. These technologies are incorporated into agricultural operations to promote sustainable cultivation and food production.
Hence, research studies are needed to increase the productivity and efficiency of durians in Southern Thailand while reducing costs through production factors and considering the other factors affecting farmers’ durian planting. Alongside, Durian farmers in the southern region need to become more competitive in agriculture to reduce the risk of depressed product prices that might happen in the future.
2. Literature Review
2.1 SBM-DEA Approach
Koopmans (1951) was the first to introduce the concept of efficiency. According to the production efficiency concept, a manufacturer is productive if their output cannot be increased without decreasing the quantity of another output. Debreu (1951) developed the Distance Function theory of productivity. The proposed method utilizes the Frontier technique to quantify the emission of production radiation along the production boundary line. Farrell introduced the concept of evaluating economic performance using a quantitative approach 1957. The frontier estimates this tool compares the relative efficiency underestimation and then measures productivity by determining the distance between the point under consideration and the frontier. There are two primary categories for assessing efficacy: 1. Data Envelopment Analysis (DEA), a mathematical method that employs linear programming or non-parametric approaches, and 2. Stochastic Frontiers (SFA) is a computer method that employs econometric methodologies. For parametric estimation, this study employs maximum likelihood (ML) and Ordinary Least Squares (OLS) techniques (Farrell, 1957). The Data Envelopment Analysis (DEA) method was developed by Charnes, Cooper, and Rhodes (1978). Data Envelopment Analysis (DEA) was developed as a non-parametric method for evaluating and comparing the efficacy of various Decision-Making Units (DMUs). Most DEA methodologies research investigates optimal activities and performance metrics (Charnes et al., 1978). Banker, Charnes, and Cooper (1984) set out to extend Charnes’ initial research by categorizing the change in size measurement derived from the frame analysis technique. Consequently, the BBC paradigm was observed to be utilized.
Slack-base Measurement approach is the frame analysis approach known as SBM, which uses a weighted methodology to evaluate the percentage of input, surplus, and deficit outputs, in addition to doing scarcity analysis. The study employed the SBM data frame analysis technique to address internal tensions. The method utilized by the DEA, in conjunction with the SBM model, for data framework analysis facilitates a direct alignment between the scarcity of input and output components. Performance is evaluated by assessing scores ranging from 0 to 1 and determining whether there is a lack of scarcity in the input and output components when a decision-making unit is located at the production set border. Business sectors, including agriculture, hotels, aviation, and energy, use the SBM model to measure performance. A literature review found that the agriculture sector uses the most SBM model research (Tone, 2001).
According to a study of the agriculture sector shows that Deng, Li, and Song (2016) used the DEA enclosed analysis method in conjunction with the SBM model to investigate efficiency in various sectors. China conducted research at the provincial level to quantify water usage efficacy and investigate variables. The water efficacy of 31 provinces was studied using the SBM data frame analysis method. Beijing, Shanghai, and Tianjin are among the most water-efficient provinces in China. The primary contributor to inefficient water usage is labor. Kuang, Lu, Zhou, and Chen (2020) examine the effective use of cultivated land in China, accounting for carbon emissions caused by this use. The paper examines data from 31 Chinese provinces from 2000 to 2017 using a Slack-based measure (SBM) model with unwanted outputs. According to the data, Chinese cultivated land use efficiency (CLUE) has increased by 38.40% over the last five years. CLUE, on the other hand, has significant regional inequalities among provinces. Many factors contribute to these discrepancies, including natural circumstances, cultivated land resources, agricultural production conditions, and regional economic growth. The study offers insights into China’s sustainable growth and effective land use. Chen, Miao, and Zhu (2021) assess China’s agricultural green total factor productivity (AGTFP), considering CO2 and non-point source pollution. It eliminates external and random errors using a three-stage SBM-DEA model, revealing significant regional changes, low efficiency in Beijing and Shanghai, and consistent dynamic changes across regions. These results contribute to the theoretical research on agricultural green development indicators, reduce regional disparities, and guide cleaner agricultural production. Żyłowski and Kozyra (2023) investigate the eco-efficiency of winter wheat, triticale, and oilseed rape. It discovered that triticale had the lowest per-hectare GHG emissions and oilseed rape had the highest using the SBM-DEA model and GAMLSS. There was a 20-32% smaller carbon footprint per kilogram of production produced by efficient farms, producing better yields using less fertilizer and fuel. Larger cultivated areas resulted in higher efficiency ratings, but neither economic size nor farm type had an apparent effect. Weather strongly affected efficiency, with higher temperatures and more precipitation in the spring enhancing efficiency and decreasing efficiency in the summer.
Based on the previous literature review, it concluded that the SBM-DEA model is a quality and appropriate tool for measuring the efficiency and production capability of durians.
2.2 Input-output Variables
The objective of increasing the efficiency and production capability of durian farming is to maximize output given the set of inputs or to get the highest yield with the fewest resources available. Understanding the dynamics of these variables can help improve the efficiency of durian farming operations.
The review of relevant literature found that Krasachat (2012) used a stochastic frontier production function method to evaluate the technical inefficiency of specific durian farms. The study considers several factors: labor, land, other inputs, and durian output. The technological inefficiency of durian plantations in Thailand may be examined using these characteristics as a starting point. Parichatnon, Maichum, and Peng (2017) conducted a study on durian production in Thailand over five years, spanning from 2012 to 2016. The study included 22 provinces located in four different regions of Thailand. The research used secondary data from many Thai governmental departments, including the Ministry of Labour, Ministry of Agriculture and Cooperatives, and Office of Agricultural Economics. The assessment included six fundamental inputs: planted area, harvested area, labour force, fertilizer, pesticides, and equipment. The output refers to the amount of durian that was created. Made, Suaria, and Ni Putu Anom (2018) highlighted the proper fertilizer application rate for durian plants in connection to the vegetative development stage of leaf buds following fruit harvest. This information is meant to help plant growers determine when to fertilize based on when leaves and vegetative plant growth are most closely correlated. Datepumee, Sukprasert, Jatuporn, and Thongkaew (2019) aimed to investigate the underlying economic, social, and technological factors that influence durian production as well as other factors that can limit a farmer’s capacity to grow superior durian fruits for export. Thirteen variables, including agricultural methods, environmental circumstances, and demographic characteristics, impact the export potential of durian growers. A logit model with a significance level of 90% or higher revealed that eight of these0 variables pest spread, fruit thinning, maturity inspection, training attendance, fertilizer application during fruit development, pruning, income, and soil texture have a significant impact on the capacity to produce high-quality durians for export. Thongkaew, Jatuporn, Sukprasert, Rueangrit, and Tongchure (2021) focused on the factors influencing durian production in Thailand, particularly in the eastern provinces of Chanthaburi, Rayong, and Trad. This study found that farmers’ expertise in cultivating durian, the size of the workforce, the planted area of durian, the number of durian trees, and the number of durian trees per planted area, farmers’ age and organic durian growing. In contrast, the results show a detrimental impact on durian yield.
The frequency of use from various studies will be identified as the input-output variables that affect durian cultivation efficiency in Southern Thailand. As a result of literature reviews and related research, the following Input-output variables can be identified in Table 1.
Table 1. Description of variables items and resource
| Variables | Source | Unit | Definition |
| Inputs | |||
| Durian cultivation area | Krasachat, (2012); Parichatnon et al., (2017); Thongkaew et al., (2021) | Hectare | The number of agricultural land that is utilized for durian cultivation. |
| Fertilizer | Made., et al. (2018); Parichatnon et al., (2017); Datepumee et al., (2019) | Baht | Total cost of a material improves soil fertility by adding nutrients necessary for plant development. |
| Chemicals used to prevent/kill pests | Parichatnon et al., (2017) | Baht | Total cost of chemicals used to prevent, repel, or destroy pests. |
| Labor | Krasachat, (2012); Parichatnon et al., (2017) | person | Workers aged 15 to 60 years old, who are involved in durian production. |
| Output | |||
| Durian production | Krasachat, (2012); Parichatnon et al., (2017) | Kilogram | Quantity of durians produced overall |
Source: compiled by the author
2.3 Tobit Regression Approach
Tobit’s regression model, also known as the Tobin model, was created in 1958 by the economist James Tobin. The term “Tobit” is derived from the combination of the last name of the renowned economist James Tobin with the statistical term “probit.” Tobin created the model in response to a circumstance that arose while examining the relationship between household consumption and income. The findings indicate that many low-income households need help to cover their expenses. This results in the clustering of data with no value. Integrating censored data is problematic for the application of simple least squares regression, as it has the potential to produce non-normal distributions in statistical analysis. To address this issue, Tobin developed the Tobin model, a modified form of the censored regression model in which the observed variable is the maximal value between the latent variable and zero. This function enables the model to manipulate suppressed data with statistical adequacy. The Tobit model has been extensively utilized in econometrics and other fields (Tobin, 1958).
Furthermore, Song, Wang, and Zeng (2018) did an inquiry on the performance indicators of water resources in Chinese provinces. This study was accomplished by thoroughly researching existing literature and pertinent studies. The Malmquist-Luenberger Yield Index was utilized to evaluate the adverse results seen in 30 provinces in China from 2006 to 2015. Subsequently, the Tobit model will be applied to analyze the many factors that impact the efficacy of water resource utilization. A noticeable discrepancy exists in the effectiveness of water resource usage throughout the several provinces. Water resource efficiency is strongly linked to economic development. Technological advancements are paramount in maximizing the efficient exploitation of water resources. The relationship between the efficiency of water resources and economic growth has a non-linear pattern. Improving the industrial infrastructure and increasing the population can significantly enhance the efficiency of water resources. The study revealed that the impact of water availability and per capita education levels was insignificant.
Dalei and Joshi (2020) conducted research examining the technical performance parameters of twelve oil refineries in India over six years, spanning from 2011 to 2016. The authors utilize a two-step methodology to explore and interpret the data. The initial stage involves the utilization of Data Envelopment Analysis (DEA) to assess the technical efficiency of the refineries. The second phase consists of utilizing a Tobit Regression model to elucidate the fluctuations in performance concerning the underlying variables. The efficiency analysis from 2011 to 2016 indicated that the IOCL-Barauni, BPCL-Kochi, and IOCL-Panipat refineries demonstrated significant efficiency. The refineries continually upheld an average efficiency rate above 95%. The regression analysis conducted on the Tobit model revealed that four key factors significantly influence the variability in distillation efficiency.
2.4 Influencing Variables
Understanding the factors influencing durian farming efficiency in Southern Thailand is essential for designing a more successful cultivation policy. Based on literature reviews and relevant research, the following studies demonstrating factors influencing efficiency and productivity can be presented as follow: MohdIdris, Siwar, and Abdul Talib (2014) investigated the drivers of cash-crop production efficiency among Malaysian farmers, with a particular emphasis on the effect of the Integrated Agricultural Development Project (IADP). Farmers remain inefficient despite obtaining many advantages, mainly from the government. The study measures technical efficiency using Data Envelopment Analysis (DEA). It explores efficiency factors by measuring farmer variables such as age, education level, family labor, years of agricultural experience, society membership, and farm size. The Tobit Model is utilized for estimating. The data show that most cash-crop growers in the IADP are inefficient. Factors such as dependency on family labor, years of farming expertise, and community membership all substantially impact efficiency levels. This data is critical for extension services and policymakers because it may help them develop policies. Raheli, Rezaei, Jadidi, and Mobtaker (2017) conducted this study to assess the sustainability and efficiency of tomato production and to look into the factors contributing to inefficiency in tomato farming in the Marand district of East Azerbaijan province, Iran. The study found that all identified criteria substantially influence tomato producer efficiency. Age, education level, and total land size all favor efficiency, with age as a proxy for farming expertise. Farmers gain knowledge and abilities through time, allowing them to pick appropriate new agricultural technology and plan well, resulting in efficient input usage. Farmers with more excellent education were shown to be more efficient, and larger land sizes also improved efficiency owing to increased automation levels, maximizing agricultural inputs such as diesel fuel and machinery.
In their study, Wang, Zhou, Yang, and Wu (2020) examined the environmental efficiency of 18 ports belonging to five port groups in China. The authors utilized data from the years 2012 to 2016 and employed Data Envelopment Analysis (DEA) as a method to assess the effectiveness of these ports. Furthermore, the efficiency of China’s green port was found to be generally low based on the research conducted using Tobit’s regression model, which examined the elements impacting its efficiency. Several challenges and issues accompany the development of a green port compared to the existing competitive development paradigm among ports. The suggested development model has a greater propensity for enhancing the operational effectiveness of China’s environmentally sustainable ports. Furthermore, it has been observed that the efficiency of green ports may be improved by factors such as economic growth, industrial structure, the presence of ports, passenger volume, international commerce, and regional openness. The emissions of nitrogen oxides (NOX) and sulfur oxides (SOX) from ports have a substantial adverse effect. The frequency of findings from different research will be used to identify and quantify the influence of these influencing variables on durian farming efficiency in Southern Thailand. Therefore, from literature reviews and relevant research, the influential factors can be identified as follow Technical efficiency of durian cultivation, female-male, education level, the number’s member in the family, experience in durian cultivation, number of training sessions and members of agricultural organizations, (MohdIdris et al., 2014; Raheli et al., 2017; Wang et al., 2020).
3. Methodology
3.1 SBM-DEA Approach
The increasing efficiency and production capability of durian in Southern Thailand for durian farmers in all four provinces was measured utilizing research data from two distinct sources. These sources encompass primary data acquired through surveys conducted among durian farmers and secondary data obtained from the annual data collection conducted by the Office of Agricultural Economics. Using the SBM-DEA model, one year of operational performance of durian farmers in four provinces is measured in the context of the SBM-DEA model, DMUj is supposed to be the efficiency of the SBM-DEA model as a set of decision units (DMUs) by J = {1, 2, …, n}, where each DMU has m as input and s as an output. This study reveals the vectors of DMUj inputs and outputs, assigning xj = (x1j, x2j, …, xmj)T and giving yj = (y1j, y2j, …, ysj)T. In addition, this study attempts to determine the metrics of input-output factors, denoted X and Y, respectively.

Based on the relevant performance of DMUj DMUj
, allowing
where there is the insufficiency of inputs is zero
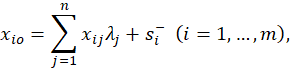
and there is a scarcity of output that might not be zero

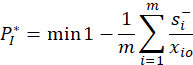
This study employs linear equations to solve the problems, Consequently, the data structure of the SBM model’s inputs for Constant return to scale (CRS) is depicted below.
quently, the data structure of the SBM model’s inputs for Constant return to scale (CRS) is depicted below.
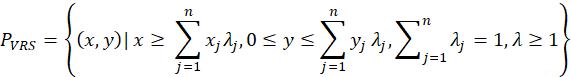
This study presents the SBM baseline mode under the DMU hypothesis of 1 based on the variable return to scale (VRS) as it is utilized in incompletely competitive market conditions, with the data hypothesis defined positively by X > 0 and Y > 0. Following this, the production capability under the VRS model can be described as follows.
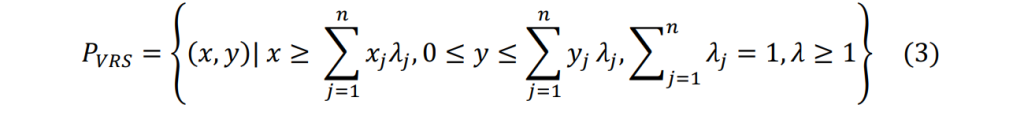
![]() consists of the intensity vector. The output boundary of the SBM model under the concept of variable return to scale (VRS) is depicted below.
consists of the intensity vector. The output boundary of the SBM model under the concept of variable return to scale (VRS) is depicted below.
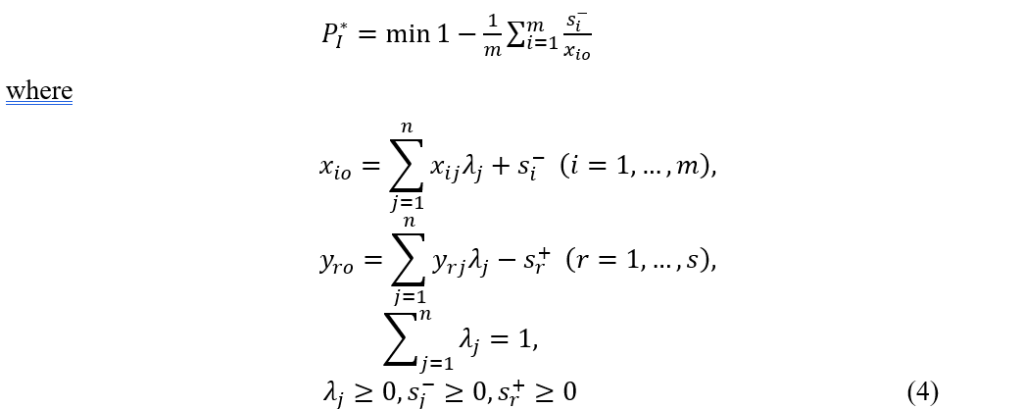
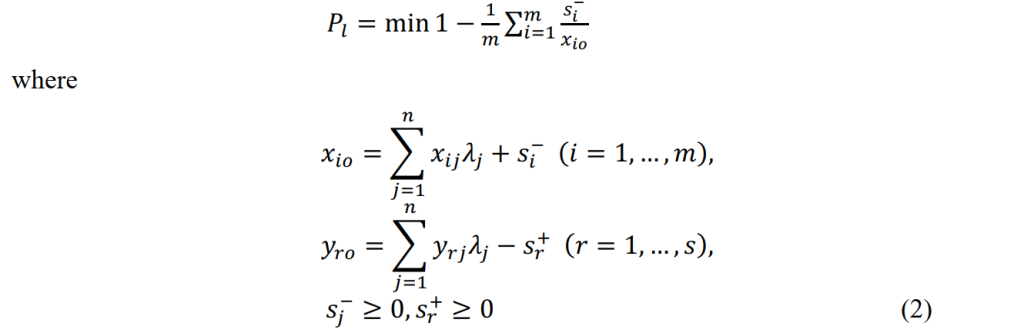
The study will use VRS model conditions to reflect actual circumstances and operations. Scarcity is stated as a lack of resources in model 4, where the VRS model is a format for data framework analysis in the Slack Measurement Mode, which is described by ![]() (Banker et al., 1984).
(Banker et al., 1984).
3.2 Tobit Regression
The Tobit regression model, developed by James Tobin in 1958, is a statistical model designed to handle continuous variables that may contain missing or unobservable values. It is beneficial when dealing with variables derived from continuous measurements, where specific values may be unmeasurable or missing and where the variable’s value stays below zero. Hence, the statistical model used in this study was denoted as the Censored Regression Model, after that recognized as the Tobit model, named after its originator (Tobin, 1958). The equation can be written as follows:
Yi = β0 + β1x1i + β2x2i + …+ βkxki + εi , i = 1,…, n (5)
Yi is a variable based on x1i, x2i, …., xki is the 1st independent variable up to the one at k.
β is, Unknown regression coefficient
ɛi is a random discrepancy and εi~ N (0, σ2)
4. Results and discussion
This research will provide an overview of relevant literature and a field survey to understand durian cultivation problems in southern Thailand. The research area comprises Chumphon, Surat Thani, Nakhon Si Thammarat, and Trang Province. A questionnaire was used to collect data from 600 Monthong durian farmers in four southern provinces of Thailand, and the SBM-DEA method under the VRS model was used to analyze their technical efficiency. Comparators are also used to improve the efficiency of decision-making units (DMUs) by increasing or decreasing input and output variables. In addition, the research team used a Tobit regression model to analyse factors affecting the efficiency and capacity of durian cultivation and production in southern Thailand. The research team would like to find the crucial factors that lead to determining government and private agencies’ strategies or action plans for durian planting and production.
4.1 The results of data analysis of durian production
The researcher analysed the general data of the respondents, who were Mon Thong durian farmers in 4 provinces in southern Thailand. This research uses descriptive statistics to explain the frequency distribution and percentage value to describe the general characteristics of the respondents’ available data variables, including gender, age, education level, occupation, and income. The results of the study found that the gender aspect of the respondents found that the majority were male, with 504 people representing 84%, which was higher than females, with 96 people representing 16% of the way. Regarding the age of the respondents, it was found that they were less than or equal to 30 years old, with no respondents. The respondents were 31-40 years old; there were 236 people, representing 39.33 %. The respondents were between 41 and 50 years old and 316 people, representing 52.66%, the majority of the respondents. Next, 46 people aged 51-60, representing 7.66%, and two people aged 61 years and over, representing 0.33%, respectively. The average age was about 42.003 years in terms of the education level of the respondents. It was found that most respondents had a lower secondary education level of 285 people, representing 47.50%, followed by those with higher education levels. Upper secondary school or vocational have 234 people or 39.0%. Those with a vocational degree or diploma of 56 people, representing 9.33 %, followed by those with a bachelor’s degree 23, representing 3.83%, and those with a postgraduate education have 2 people, representing 0.33% respectively. Occupational aspects of the respondents: It was found that most of the respondents had durian cultivation and other occupations, amounting to 364 people, representing 60.66%, followed by durian cultivation only, 236 people, representing 39.34%. When answering the questionnaire classified by income per hectare per year, it was found that with income between 40,000-50,000 baht, there are 138 people representing 23 % which have income 50,001-60,000 baht, totalling 336 people representing 56%, and income between 60,001-70,000 baht, increasing efficiency 126 people, representing 21%. Moreover, the total income per hectare of durian farmers in 4 areas of Thailand has an average income of 54,832 baht per hectare per year. The analysis results of durian production and efficiency in the southern region of Thailand show that the import variables and yields of durian growers in the southern region of Thailand have the highest value of 9 hectares and the lowest was 0.3 hectares, with an average durian cultivation area of 2 hectares per household. The values used in the performance analysis ranged from -1.0 to +1.0.
According to the results in Table 2, the durian cultivation area (X1) is 60 hectares. The lowest is 2 hectares, with a standard variation of 6.13142 hectares, and the average agricultural area is around 12.845 hectares. Fertilizer (X2) costs range from 11,000 to 320,000 baht, averaging 69,201 baht. The standard deviation is 33,296.17 baht, demonstrating that farmers’ fertilizer expenses vary—chemicals to prevent/kill pests (X3) range in price from 13,500 baht to 330,000 baht. With a standard deviation of 36,717.77 baht, the average cost is around 73,343.95 baht. The labor (X4) ranges from one to eight persons, with an average of about two people and a standard deviation of 0.578732, showing a minor fluctuation in labor force size. Durian production (Y1) ranges from 1,632 kilograms to 75,623 kilos. The average output is roughly 13,761.12 kilograms, with a standard deviation of 9,958.137 kilos, indicating variety in production outcomes. From Table 3, the inputs are durian cultivation area (X1), fertilizers (X2), chemicals used to prevent/kill pests (X3), and labor (X4). The production sector consists of durian consumption when considering the relationship with other variables, which have the value approach 1, which means that the above variables and other variables have many correlations in the same direction. However, except for the labor variable, it was equal to 0.59.
Table 2. Data of input and output variables of durian growers
| Durian cultivation area (Hectare) (X1) | Fertilizer (Baht) (X2) | Chemicals used to prevent/kill pests (Baht) (X3) | Labor (person) (X4) | Durian production (Kilogram (Y1) | |
| Max | 60 | 320000 | 330000 | 8 | 75623 |
| Min | 2 | 11000 | 13500 | 1 | 1632 |
| Average | 12.845 | 69201 | 73343.95 | 2.008333 | 13761.12 |
| SD | 6.13142 | 33296.17 | 36717.77 | 0.578732 | 9958.137 |
Source: author’s calculated
Table 4 shows the number of decision-making units, the efficiency and inefficiency of the decision unit, and the maximum, minimum, and mean values of the technical performance values were found. The technical performance of 600 DMUs from the decision-making unit is calculated as an average of 0.520962. The technical performance score is classified as a relatively low level. In addition, the technical performance analysis also found that the number of effective decision units was 11 DMUs, technically not as efficient as 589 DMUs, and the lowest decision unit efficiency score was 0.203939. Table 5 shows that the effective decision-making units have 11 DMUs and reference sets for comparability and reference frequencies. Results from calculating the technical efficiency of durian growers in the southern region of Thailand found that the technically efficient decision-making units were 11 DMUs out of a total of 600 DMUs, comprising DMU 8, DMU 13, DMU 16, DMU 29, DMU 37, DMU 50, DMU 136, DMU 138, DMU 140, DMU 392 and DMU 551 by 11 DMUs technically efficient decision-making units. It is arranged as a reference set to be a comparison set. The technical performance analysis found that DMU 140 had the highest reference frequency, equal to 499, followed by DMU 37, with a frequency equal to 482. DMU 8 has a reference frequency of 64, DMU 551 has a reference frequency of 62, DMU 13 has a reference frequency of 18, DMU 136 has a reference frequency of 17, DMU 16 has a reference frequency of 10, and DMU 50 has a reference frequency of 9, with DMU 29, DMU 138, and DMU 392 not being used.
Table 3. Relationship of input and output variables of durian growers
| Input and output variables | Durian cultivation area (Hectare) | Fertilizer (Baht) | Chemicals used to prevent/kill pests (Baht) | Labor (person) | Durian production (Kilogram) |
| Durian cultivation area (X1) | 1 | 0.982908 | 0.935889 | 0.596399 | 0.827007 |
| Fertilizer (X2) | 0.982908 | 1 | 0.951821 | 0.598361 | 0.823401 |
| Chemicals used to prevent/kill pests (X3) | 0.935889 | 0.951821 | 1 | 0.579454 | 0.821074 |
| Labor (X4) | 0.596399 | 0.598361 | 0.579454 | 1 | 0.537815 |
| Durian production (Y1) | 0.827007 | 0.823401 | 0.821074 | 0.537815 | 1 |
Source: author’s calculated
Table 4. Shows the number of decision-making units, the maximum value, the minimum value and the mean value of the technical efficiency
| Detail | Number |
| No. of DMUs | 600 |
| Average | 0.520962 |
| SD | 0.143075 |
| No. of efficient DMUs | 11 |
| No. of inefficient DMUs | 589 |
| Maximum | 1 |
| Minimum | 0.203939 |
Source: author’s calculated
Table 5. Shows effective decision units of 11 DMUs and reference sets for comparison and reference frequencies
| Number | Reference set | Reference frequencies |
| 1. | DMU 8 | 64 |
| 2. | DMU 13 | 18 |
| 3. | DMU 16 | 10 |
| 4. | DMU 29 | 0 |
| 5. | DMU 37 | 482 |
| 6. | DMU 50 | 9 |
| 7. | DMU 136 | 17 |
| 8. | DMU 138 | 0 |
| 9. | DMU 140 | 499 |
| 10. | DMU 392 | 0 |
| 11. | DMU 551 | 62 |
Source: author’s calculated
In addition, reference sets are to be compared. A decision-making unit (DMU) with efficiency equal to 1, A DMU is used as a reference set. It considers the improvements, increases, or decreases of the input or seeding variables. Durian planting in the southern region can use the reference set as a comparison from Table 6. It shows the durian cultivation efficiency of 600 farmers in south Thailand. From Figure 1, the research team could classify the efficiency scores of 600 DMUs. There were durian farmers in the southern region of Thailand into three large groups based on the total collection area of 4 provinces in the southern region of Thailand. The review found that Group 1, from DMU1 to DMU150, had a total of 150 DMUs covering the entire Chumphon province. The range of performance scores for each decision unit was significantly higher than in the other regions.
Table 6. Durian cultivation efficiency of 600 farmers in southern Thailand
| No. | DMU | Score | Rank | Reference set (lambda) | |||
| 1 | 1 | 0.602051 | 108 | 37 | 0.312503 | 140 | 0.687487 |
| 2 | 2 | 0.55418 | 192 | 37 | 0.687502 | 140 | 0.312488 |
| 3 | 3 | 0.576289 | 134 | 37 | 0.437503 | 140 | 0.562487 |
| 4 | 4 | 0.553028 | 204 | 37 | 0.875002 | 140 | 0.124988 |
| 5 | 5 | 0.722281 | 62 | 8 | 0.833322 | 37 | 0.166668 |
| 6 | 6 | 0.722281 | 62 | 8 | 0.833322 | 37 | 0.166668 |
| 7 | 7 | 0.858236 | 23 | 8 | 0.944433 | 37 | 5.56E-02 |
| 8 | 8 | 1 | 1 | 8 | 1 | ||
| 9 | 9 | 0.580023 | 126 | 37 | 0.375002 | 140 | 0.624988 |
| 10 | 10 | 0.607025 | 105 | 13 | 0.071429 | 37 | 0.928571 |
| 11 | 11 | 0.652484 | 92 | 13 | 0.142857 | 37 | 0.857143 |
| 12 | 12 | 0.941551 | 17 | 13 | 0.857143 | 37 | 0.142857 |
| 13 | 13 | 1 | 1 | 13 | 1 | ||
| 14 | 14 | 0.768491 | 50 | 13 | 0.357143 | 37 | 0.642857 |
| 15 | 15 | 0.556136 | 185 | 37 | 1 | ||
| 16 | 16 | 1 | 1 | 16 | 1 | ||
| 17 | 17 | 0.608761 | 104 | 16 | 0.2 | 37 | 0.8 |
| 18 | 18 | 0.591243 | 112 | 37 | 0.375003 | 140 | 0.624988 |
| 19 | 19 | 0.557142 | 177 | 37 | 0.687502 | 140 | 0.312488 |
| 20 | 20 | 0.554983 | 190 | 37 | 1 | ||
| . | . | . | . | . | . | . | . |
| . | . | . | . | . | . | . | . |
| 590 | 590 | 0.829768 | 30 | 140 | 0.127705 | 551 | 0.872285 |
| 591 | 591 | 0.367161 | 545 | 37 | 2.47E-02 | 140 | 0.975283 |
| 592 | 592 | 0.360727 | 548 | 37 | 0.045838 | 140 | 0.954152 |
| 593 | 593 | 0.350058 | 566 | 37 | 6.70E-02 | 140 | 0.93302 |
| 594 | 594 | 0.471199 | 310 | 8 | 0.647587 | 140 | 0.352403 |
| 595 | 595 | 0.797418 | 43 | 140 | 0.127705 | 551 | 0.872285 |
| 596 | 596 | 0.658028 | 87 | 140 | 0.383104 | 551 | 0.616886 |
| 597 | 597 | 0.349948 | 568 | 37 | 6.70E-02 | 140 | 0.93302 |
| 598 | 598 | 0.786407 | 47 | 8 | 1 | ||
| 599 | 599 | 0.324205 | 593 | 37 | 0.130363 | 140 | 0.869627 |
| 600 | 600 | 0.541276 | 215 | 140 | 0.817845 | 551 | 0.182145 |
Table 6. Durian cultivation efficiency of 600 farmers in southern Thailand
Source: author’s calculated
In addition, when measuring the technical performance of the 150 DMUs in the Chumphon area, it was found that DMU8, DMU13, DMU16, DMU29, DMU37, DMU50, DMU136, DMU138, and DMU140 had an efficiency score equal 1 total of 9 DMUs from A total of 11 DMUs of a sample of 600 DMUs, Group 2, ranging from DMU151 to DMU450, it contained a total of 300 DMUs which covering Surat Thani and Nakhon Si Thammarat provinces. The range of technical efficiency scores of each decision unit was less than that of Chumphon, and the technical performance scores were in the same range for both Surat Thani and Nakhon Si Thammarat provinces. Furthermore, by measuring the technical performance of the 300 DMUs in the two provinces, only two decision-making units were technically efficient, DMU392 and DMU404, and the third group, DMU451 to DMU600. Moreover, decision-making units have 150 DMUs that cover Trang provinces. The range of technical efficiency scores of each decision unit was the smallest when comparing data collection areas in all four provinces. The technical performance measurement of 150 DMUs in Trang province found that DMU551 had the lowest technical performance score. Consequently, the findings on durian cultivation in Southern Thailand provide encouraging directions for raising the productivity and efficiency of this significant local crop. They may boost yields and improve the plants’ health by optimizing the input variables of fertilizer (X2) and chemicals used to prevent/kill pests (X3).

Figure 1. Efficiency score’s decision making 600 DMUs of durian farmers in southern Thailand
Source: created by the author
4.2 Factors Influencing’s Efficiency Value of Durian Cultivation
A study of the relationship of factors expected to influence the determination of change in durian cultivation efficiency in southern Thailand by Tobit Regression Analysis using the lower boundary from 0. to the upper boundary 1 to find the relationship between the efficiency scores of durian cultivation in all four provinces in the southern region of Thailand and the influencing factors in determining such efficiency levels. The model can be represented in the form of a linear regression equation as follows:
TEi = β0 + β1Gender+β2 Education+β3 Household size+β4 Experience+β5Number of times to attend training+β6 Membership of agricultural organization+εi (6)
where
TEi = Technical efficiency of durian cultivation
Gender = female male
Education = education level
Household size = the number’s member in family
Experience = Experience in durian cultivation
Number of times to attend training = number of training sessions
Membership of agricultural organization = members of agricultural organizations
The study results on the relationship of factors expected to influence the change in the efficiency level of durian cultivation in all four provinces in the southern region of Thailand by the Tobit Regression Analysis method, as shown in the table. 7. It was found that four statistically significant factors were acceptable. In contrast, there are education variables and membership of agricultural organizations variables that could not explain the change in efficiency level.
Table 7. The results show that factors affecting the efficiency of durian cultivation in four provinces (source: author’s calculated)
| Variable | Coefficient | P-value | Mean of X |
| Gender (β1) | 0.00193654 | 0.0465** | 41.9483333 |
| Education (β2) | 0.02178986 | 0.2146 | 1.87833333 |
| Household size (β3) | 0.03275840 | 0.0002*** | 3.86666667 |
| Experience (β4) | 0.01033525 | 0.0045** | 14.6500000 |
| Number of times to attend training (β5) | 0.04899838 | 0.0084** | 1.89166667 |
| Membership of agricultural organization (β) | 0.01377504 | 0.4335 | 1.89000000 |
| Variable | Coefficient | P-value | Mean of X |
Note*, ** and *** mean statistically significant at the confidence level of 90, 95 and 99, respectively.
Source: author’s calculated
The data analysis found that gender factor variables consisted of 2 genders, male and female. From the statistics of data collection, it was found that there were more males than females. The gender factor variable had a coefficient of variable (β1) of 0.00193654, greater than 0, and a statistically significant difference from zero at the 95% confidence level. An increase in males will increase the durian cultivation’s efficiency score, or explain that when a farmer has a rise of 1 male unit, the four provinces durian cultivation’s efficiency score in Southern Thailand will be increased by 0.00193654 units. The household size factor variable had a coefficient of variable (β3) of 0.03275840 greater than 0 and a statistically significant difference from zero at the 99 percent confidence level. Farmers with household sizes or more family members will increase durian cultivation efficiency scores. When the household size or family members increase by 1 unit, durian cultivation’s efficiency score in all four provinces in the southern region of Thailand will increase by 0.03275840 units. Next, the experience factor variable in durian cultivation had a coefficient of variable (β4) of 0.01033525, greater than 0, and a statistically significant difference from zero at the 95% confidence level. It can be explained that if farmers have more experience in durian cultivation, it will result in an increase in durian cultivation’s efficiency score or clarify that when they have experience in durian cultivation increased by 1 unit, the efficiency score of durian cultivation in all four provinces in the southern region of Thailand will be increased by 0.01033525 units. Moreover, the number of times to attend training factor variable had a coefficient of variable (β5) of 0.04899838, greater than 0, and a statistically significant difference from zero at the 95% confidence level. It could be explained that if the number of times to attend training for durian farmers increased, it would increase the efficiency score of durian cultivation. And the number of times to follow training increases by 1 unit, the efficiency score of durian cultivation in all four provinces in the southern region of Thailand will increase by 0.04899838 units. In contrast, the data analysis of this research found that Education (β2) and Membership in an agricultural organization (β6) had a coefficient of variables consisting of 0.00193654 and 0.01377504, respectively. Neither variable has statistically significant differences from zero at the 95% and 99% confidence levels. It could be explained that Education (β2) and Membership in agricultural organizations (β6) are not affected by the change in efficiency level. The future growth of Thailand’s durian sector depends on boosting productivity and efficiency and raising competitiveness.
5. Conclusions
From the data analysis, the research team classified the 600 DMUs from the efficiency scores of the durian farmers in the southern region of Thailand into three large groups from the four collecting areas. Group 1, from DMU1 to DMU150, has 150 DMUs covering Chumphon Province. Group 2, from DMU151 to DMU450, has a total of 300 DMUs where covering Surat Thani and Nakhon Si Thammarat provinces. Group 3, from DMU451 to DMU600, has 150 DMUs covering Trang Province. It can be concluded that Chumphon province has a significantly higher range of performance scores for each decision-making unit than other provinces. They are followed by the range of performance scores for each decision-making unit of Surat Thani and Nakhon Si Thammarat provinces. Moreover, Trang province had the lowest range of technical efficiency scores for each decision-making unit compared to the four provinces’ data collection areas. Furthermore, the research team discovered controlling input variables on the side of fertilizer and chemicals used to prevent/kill pests to increase the efficiency and production capability of durian farming in southern Thailand, which can be confirmed from the analysis of the clustering of durian-growing provinces groups. Group 1, Group 2, and Group 3 sorted the significantly higher range of performance scores.
The control of input variables consists of fertilizers and chemicals used to prevent/kill pests. It is a method for managing agricultural technology and modern innovations to help plant cultivation and maintenance. By making durian trees more robust, durian trees can produce higher yields (Parichatnon et al., 2017; Datepumee et al., 2019; Thongkaew et al., 2021). According to Tobit regression analysis, an investigation identifies factors influencing durian cultivation effectiveness in Southern Thailand. Notably, the number of male farmers, larger households, agricultural expertise, and training frequency contribute considerably to efficiency. The research team discovered that if there are increasing household size, male farmers, experience unit, and number of times to attend training, respectively. It can raise the high-efficiency score and production capability of durians in this region. In contrast, there are education variables and membership of agricultural organizations variables that could not explain the change in the efficiency level of each of the DMUs in southern Thailand (Song et al., 2018; Raheli al., 2017; MohdIdris et al., 2014).
From the study results of measurement of increasing efficiency and production capability of durian in Southern Thailand, suggestions to Durian Agricultural Cooperative go to southern regions of Thailand. Agricultural cooperatives involved in durian production are essential in promoting farmers’ cultivation ability throughout the durian production chain. Starting with support factors of production, which include varieties, fertilizers, medicines, chemicals or organic substances, materials, and equipment, until harvesting, by advising on the matter of labor harvesting and transporting produce and helping negotiate the selling price of the durian, some agricultural cooperatives will purchase and distribute the produce themselves (Office of Agricultural Economics, 2020). Moreover, the study’s results align with Thailand’s agricultural policy that places urgent importance on the quality of durian production from upstream to downstream. The report accords with the roadmap and guidelines for developing Thai fruits in 2022–2027 of the Department of Agricultural Extension, Ministry of Agriculture, and Cooperatives, giving importance to the matter of increasing durian production potential by raising the standards of durian products for export by using the guidelines to promote production according to GAP standards (Department of Agricultural Extension, 2021).
6. Suggestions
Governments or agencies involved in durian cultivation should focus on using technology to assist in cultivation, which is the most efficient production and harvesting of durian with the lowest cost. The relevant departments can compare the decision-making units using reference sets from this study. Moreover, governments or agencies can suggest that durian farmers in the southern region know how to manage their variable use on their farms regarding technology such as agricultural machinery, information technology systems, and the knowledge of using chemicals or pesticides.
Acknowledgements
- The author would like to thank the Faculty of Liberal Arts and Management Sciences at Prince of Songkla University Surat Thani Campus, Thailand, for their invaluable cooperation in providing research equipment and a workspace for this study. Moreover, this work was supported by National Science, Research and Innovation Fund (NSRF) and Prince of Songkla University (Grant No. LAM6405038S).
References
Office of Agricultural Economics. (2020). Agricultural Economic Information. https://www.oae.go.th/assets/portals/1/files/jounal/2564/commodity2563.pdf
Department of Agricultural Extension. (2019). Annual Report. https://www.doae.go.th/en/vision-mission/
Department of Agricultural Extension. (2021). Annual Report. https://www.doae.go.th/en/vision-mission/
Banker, R. D., Charnes, A., & Cooper, W. W. (1984). Some Models for Estimating Technical and Scale Inefficiencies in Data Envelopment Analysis. Management Science, 30(9), 1078–1092. https://doi.org/10.1287/mnsc.30.9.1078
Charnes, A., Cooper, W. W., & Rhodes, E. (1978). Measuring the Efficiency of Decision-Making Units. European Journal of Operational Research, 2(6), 429–444. https://doi.org/10.1016/0377-2217(78)90138-8
Chen, Y., Miao, J., & Zhu, Z. (2021). Measuring Green total Factor Productivity of China’s Agricultural Sector: A Three-Stage SBM-DEA Model with Non-Point Source Pollution And CO₂ Emissions. Journal of Cleaner Production, 318, Article 128543. https://doi.org/ 10.1016/j.jclepro.2021.128543
Dalei, N. N., & Joshi, J. M. (2020). Estimating Technical Efficiency of Petroleum Refineries Using DEA and Tobit Model: an India Perspective. Computers & Chemical Engineering, 142, Article 107047. https://doi.org/10.1016/j.compchemeng.2020.107047
Datepumee, N., Sukprasert, P., Jatuporn, C., & Thongkaew, S. (2019). Factors Affecting the Production of Export Quality Durians by Farmers in Chanthaburi Province, Thailand. Journal of Sustainability Science and Management, 14(4), 94–105. https://esciencepress. net/journals/index.php/IJAE/article/view/3617
Debreu, G. (1951). The Coefficient of Resource Utilization. Econometrica, 19(3), 273–292. https://doi.org/10.2307/1906814
Deng, G., Li, L., & Song, Y. (2016). Provincial Water Use Efficiency Measurement and Factor Analysis in China: Based on SBM-DEA Model. Ecological Indicators, 69, 12–18. https://doi.org/10.1016/j.ecolind.2016.03.052
Farrell, M. J. (1957). The Measurement of Production Efficiency. Journal of the Royal Statistical Society: Series A (General), 120(3), 253–290. https://doi.org/10.2307/2343100
Koopmans, T. (1951). Activity Analysis of Production and Allocation. John Wiley & Sons.
Krasachat, W. (2012). Organic Production Practices and Technical Inefficiency of Durian Farms in Thailand. Procedia Economics and Finance, 3, 445–450. https://doi.org/ 10.1016/S2212-5671(12)00178-5
Kuang, B., Lu, X., Zhou, M., & Chen, D. (2020). Provincial Cultivated Land Use Efficiency in China: Empirical Analysis Based on the SBM-DEA Model with Carbon Emissions Considered. Technological Forecasting and Social Change, 151, Article 119874. https://doi.org/10.1016/j.techfore.2019.119874
Lassoued, R., Phillips, P. W. B., & Smyth, S. J. (2023). Exploratory Analysis on Drivers and Barriers to Canadian Prairie Agricultural Technology Innovation and Adoption. Smart Agricultural Technology, 5, Article 100257. https://doi.org/10.1016/j.atech.2023.100257
Made, S., Suaria, I. N., & Ni Putu Anom, S. (2018). Build Recommendations Nitrogen Fertilization with the Development of the Period of Durian Crop Replanting. International Journal of Life Sciences, 2(1), 1–11. https://doi.org/10.29332/ijls.v2n1.73
Mohd Idris, N. D., Siwar, C., & Abdul Talib, B. (2014). Determinants Of Technical Efficiency Among Cash-Crop Producers: Evidence from East Malaysia. IOSR Journal of Humanities and Social Science, 19(6), 64–69. https://www.iosrjournals.org/iosr-jhss/papers/Vol19-issue6/Version-5/J019656469.pdf
Parichatnon, S., Maichum, K., & Peng, K. C. (2017). Application Of the Malmquist Productivity Index on Measurement of Productivity Trend of Durian Production in Thailand. International Journal of Business Marketing and Management (IJBMM), 2(4), 1–9. https://www.ijbmm.com/paper/Apr2017/459147691.pdf
Raheli, H., Rezaei, R. M., Jadidi, M. R., & Mobtaker, H. G. (2017). A Two-Stage DEA Model to Evaluate Sustainability and Energy Efficiency of Tomato Production. Information Processing in Agriculture, 4(4), 342–350. https://doi.org/10.1016/j.inpa.2017.02.004
Regional Letter. (2023). The Bank of Thailand (Issue No. 5). https://www.bot.or.th/content/ dam/bot/documents/th/research-and-publications/articles-and-publications/articles/ articles-regional/Regional%20Letter_the_new_challenges_for_thai_durian.pdf
Senate Secretariat. (2023). The Study Report on the Development and Promotion of Agriculture to Create Value According to the National Strategy: A Case Study of Durian Products of the Senate Committee on Agriculture and Cooperatives.
Song, M., Wang, R., & Zeng, X. (2018). Water Resources Utilization Efficiency and Influence Factors Under Environmental Restrictions. Journal of Cleaner Production, 184, 611–621. https://doi.org/10.1016/j.jclepro.2018.02.259
Thongkaew, S., Jatuporn, C., Sukprasert, P., Rueangrit, P., & Tongchure, S. (2021). Factors Affecting the Durian Production of Farmers in the Eastern Region of Thailand. International Journal of Agricultural Extension, 9(2). https://doi.org/10.33687/ijae.009. 02.3617
Tobin, J. (1958). Liquidity Preference as Behavior Towards Risk. The Review of Economic Studies, 25(1), 65–86. https://doi.org/10.2307/2296205
Tone, K. (2001). A Slacks-Based Measure of Efficiency in Data Envelopment Analysis. European Journal of Operational Research, 130(3), 498–509. https://doi.org/10.1016/ S0377-2217(99)00407-5
Wang, L., Zhou, Z., Yang, Y., & Wu, J. (2020). Green Efficiency Evaluation and Improvement of Chinese Ports: A Cross-Efficiency Model. Transportation Research Part D: Transport and Environment, 88, Article 102590. https://doi.org/10.1016/j.trd.2020.102590
Żyłowski, T., & Kozyra, J. (2023). Crop Cultivation Efficiency and GHG Emission: SBM-DEA Model with Undesirable Output Approach. Sustainability, 15(13), Article 10557. https://doi.org/10.3390/su151310557